
Overview Analysis of this Instagram Profile
230,359
Followers1,227
Following1.91%
Engagement Rate1.225%
Followers Growth Rate9.780%
Following Growth Rate1.89%
Likes Rate0.017%
Comments Rate3,198
Uploads4,357
Average Likes40
Average Comments$461 - $1,152
Average Cost per postActions
Follower / Following Statistics Analysis
Account Stats Summary
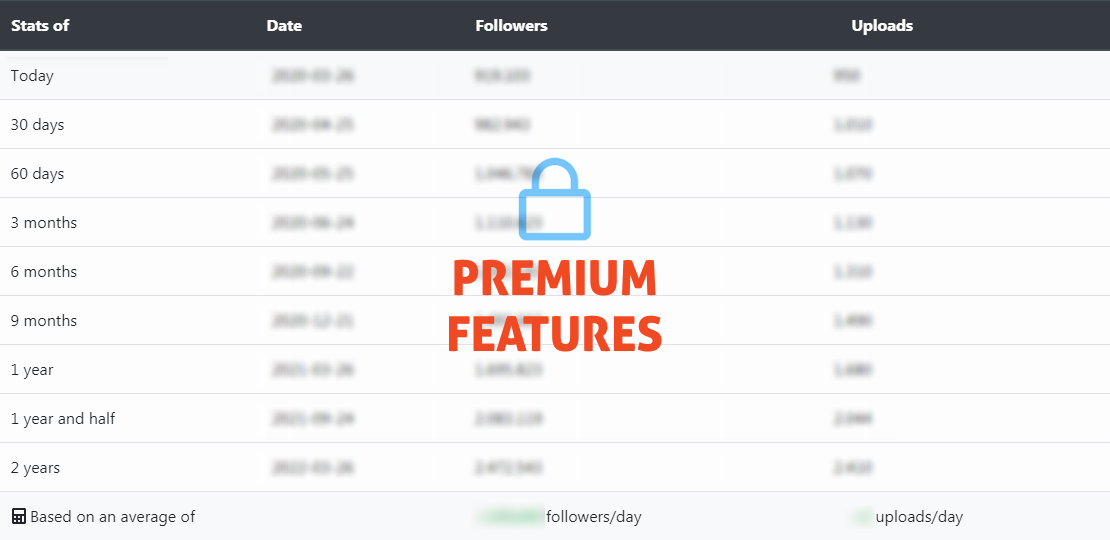
Statistics detail per day.
Download in CSV format| Date | Followers | Following | Uploads | ||||
|---|---|---|---|---|---|---|---|
| 2019-08-29 | Thu | 227,536 | 1,107 | 3,051 | |||
| 2019-11-25 | Mon | 229,503 +1,967 | 1,155 +48 | 3,106 +55 | |||
| 2019-12-01 | Sun | 230,083 +580 | 1,156 +1 | 3,112 +6 | |||
| 2019-12-23 | Mon | 230,907 +824 | 1,170 +14 | 3,136 +24 | |||
| 2020-01-04 | Sat | 230,760 -147 | 1,176 +6 | 3,150 +14 | |||
| 2020-01-17 | Fri | 231,045 +285 | 1,173 -3 | 3,162 +12 | |||
| 2020-02-11 | Tue | 231,218 +173 | 1,185 +12 | 3,167 +5 | |||
| 2020-02-20 | Thu | 230,983 -235 | 1,192 +7 | 3,171 +4 | |||
| 2020-02-26 | Wed | 230,784 -199 | 1,198 +6 | 3,174 +3 | |||
| 2020-03-01 | Sun | 230,705 -79 | 1,205 +7 | 3,183 +9 | |||
| 2020-03-12 | Thu | 230,438 -267 | 1,217 +12 | 3,192 +9 | |||
| 2020-03-20 | Fri | 230,489 +51 | 1,222 +5 | 3,192 | |||
| 2020-03-28 | Sat | 230,359 -130 | 1,227 +5 | 3,198 +6 | |||
| Total Summary | Followers: +2,823 | Following: +120 | Uploads: +147 | ||||
| Incomplete statistics? Register your account to update this account's statistics! | |||||||
Average Engagement Rate Chart
Each value in this chart is equal to the Average Engagement Rate of the account in that specific day.
Engagement is the numerical value determined by the relationship between the number of followers and the interactions on the photos.
(Note: the higher the number of followers, the lower the engagement. See table comparison at the bottom of the page)
Top #Hashtags
Top hashtags from the last 10 posts
Average Engagement Rates on Instagram
These are overall / average engagement rates found on Instagram. Statistics based on analysis of more than 1 million influencer profiles.
| Followers | Average Values of Instagram Profiles | Profile Engagement |
|---|---|---|
| < 1,000 | 8% | |
| < 5,000 | 5.7% | |
| < 10,000 | 4% | |
| < 100,000 | 2.4% | |
| 100,000+ | 1.7% |
|
FAQ - 𝐂𝐈𝐍𝐃𝐘 𝐒𝐎𝐋𝐃🦋 Instagram Account
Some of the most frequently asked questions users ask about Instagram's profile 𝐂𝐈𝐍𝐃𝐘 𝐒𝐎𝐋𝐃🦋.
The current biography of this account is "𝐥𝐚𝐜𝐢𝐧𝐝𝐢𝐧𝐚.𝐬𝐨𝐥𝐝@𝐠𝐦𝐚𝐢𝐥.𝐜𝐨𝐦 🎨 𝐌𝐔𝐀 𝐎𝐅 𝐏𝐀𝐒𝐒𝐈𝐎𝐍 ✨ 𝙘𝙤-𝙛𝙤𝙪𝙣𝙙𝙚𝙧 𝙤𝙛 @mulaccosmetics 🦋 𝐃𝐑𝐄𝐀𝐌𝐄𝐑 🍼 𝐌𝐎𝐌 🔽 𝐘𝐎𝐔𝐓𝐔𝐁𝐄 🔽"
At the last check, this Instagram profile turns out to have 230,359 followers.
The engagement rate of this Instagram profile is 1.91% (higher than the average of 1.7%) , calculated on the average of the last 10 posts.
The average of the likes received is approx 4,357 for every post published on Instagram.
The average of the comments received for each post published by this profile is approx 40.
𝐂𝐈𝐍𝐃𝐘 𝐒𝐎𝐋𝐃🦋 account is completely abandoned; he hasn't posted any new updates in over a year.
On average, about 1,89% of the followers of this profile likes the contents, and about 0,017% write a comment.
Based on the CPM Rate formula, buying a post on this profile could cost up to $1,152.
The most mentioned profiles are @michelemassafra, @shape_republic_it, .
The most used hashtags are #iorestoacasa, #quarantena, #workoutmotivation, #quarantineworkout, #tiktokitalia, #tiktok, #quarantenamood, #shaker, #QUARANTENA, #quarantenachallenge, #quarantenaworkout, #andratuttobene, .
The last check we carried out took place on 2020-03-28 12:06:46 (UTC+1).
The next statistics update will be available starting from 2020-03-29 12:06:46 (UTC+1).
Note: Only registered users can update report statistics. Register your account to update this profile statistics!
